Imogen Todd

I’m a digital designer creating engaging data products at my day job and coding websites (like this one) in my free time.

For freelance opportunities or case studies of recent projects, please reach out at imo.todd@gmail.com

Parsons Infographic Certificate
2021

Berlin Wall Deaths

Data Viz, UX/UI, and coding

See Description

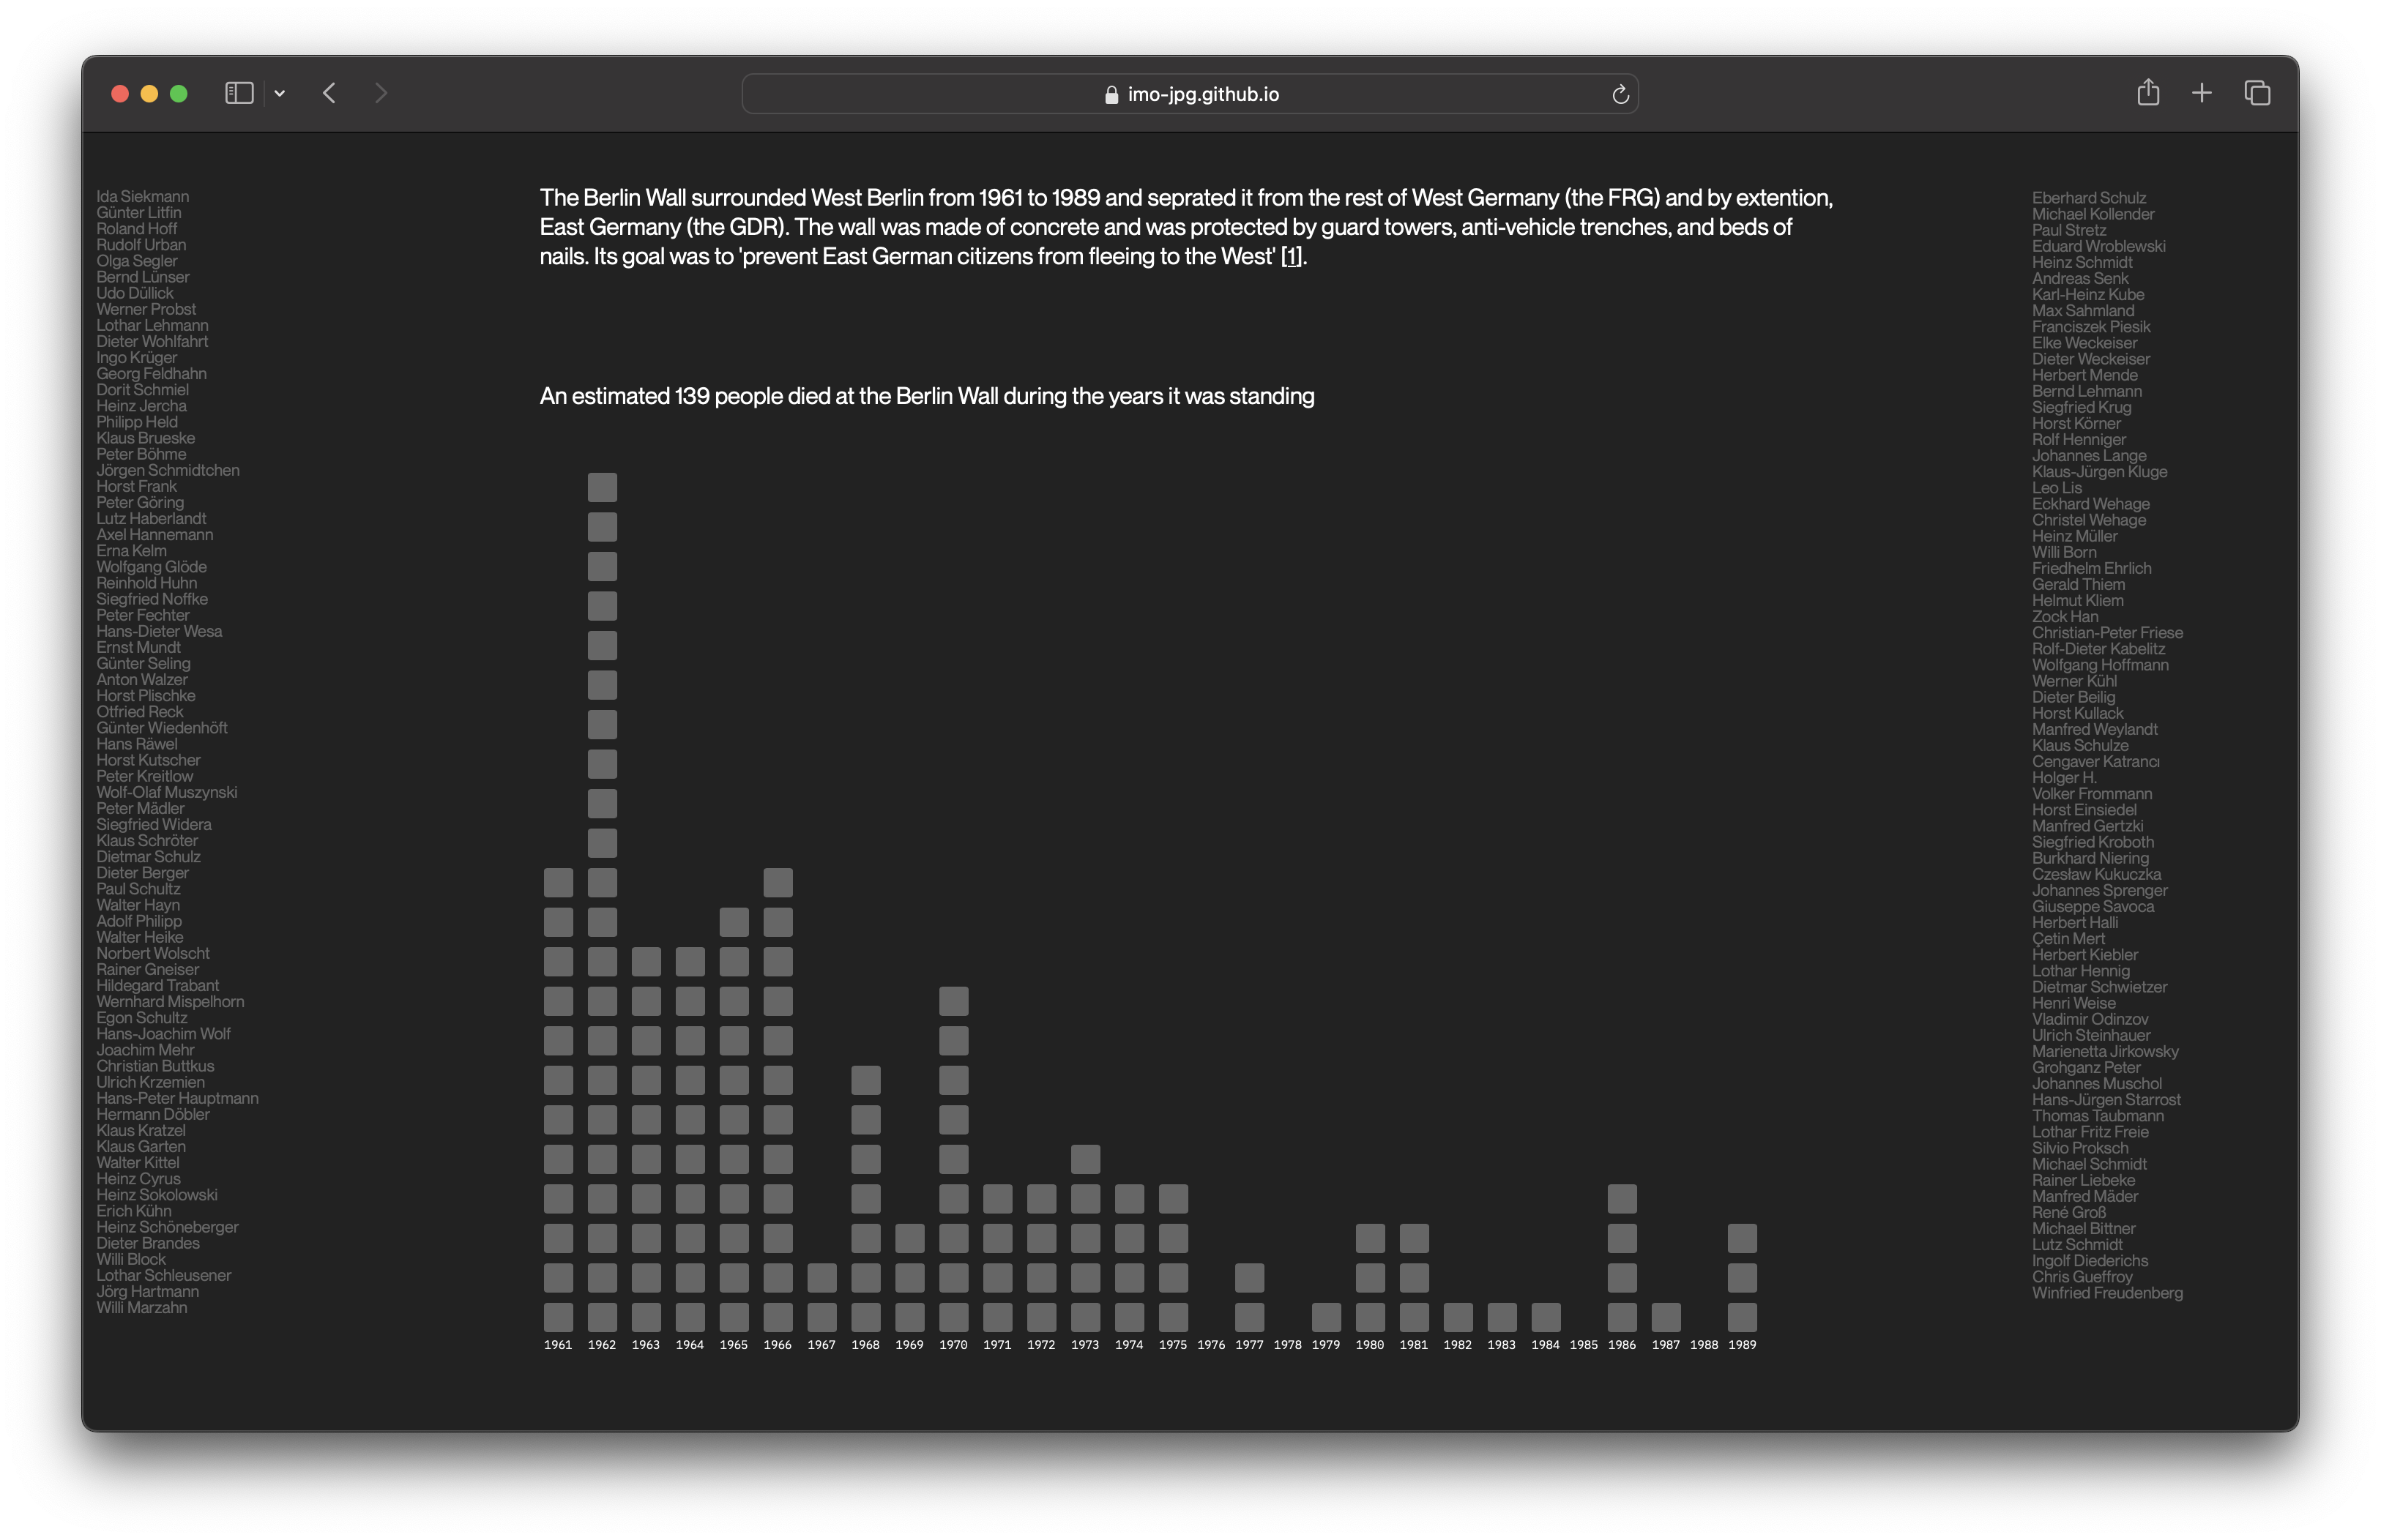
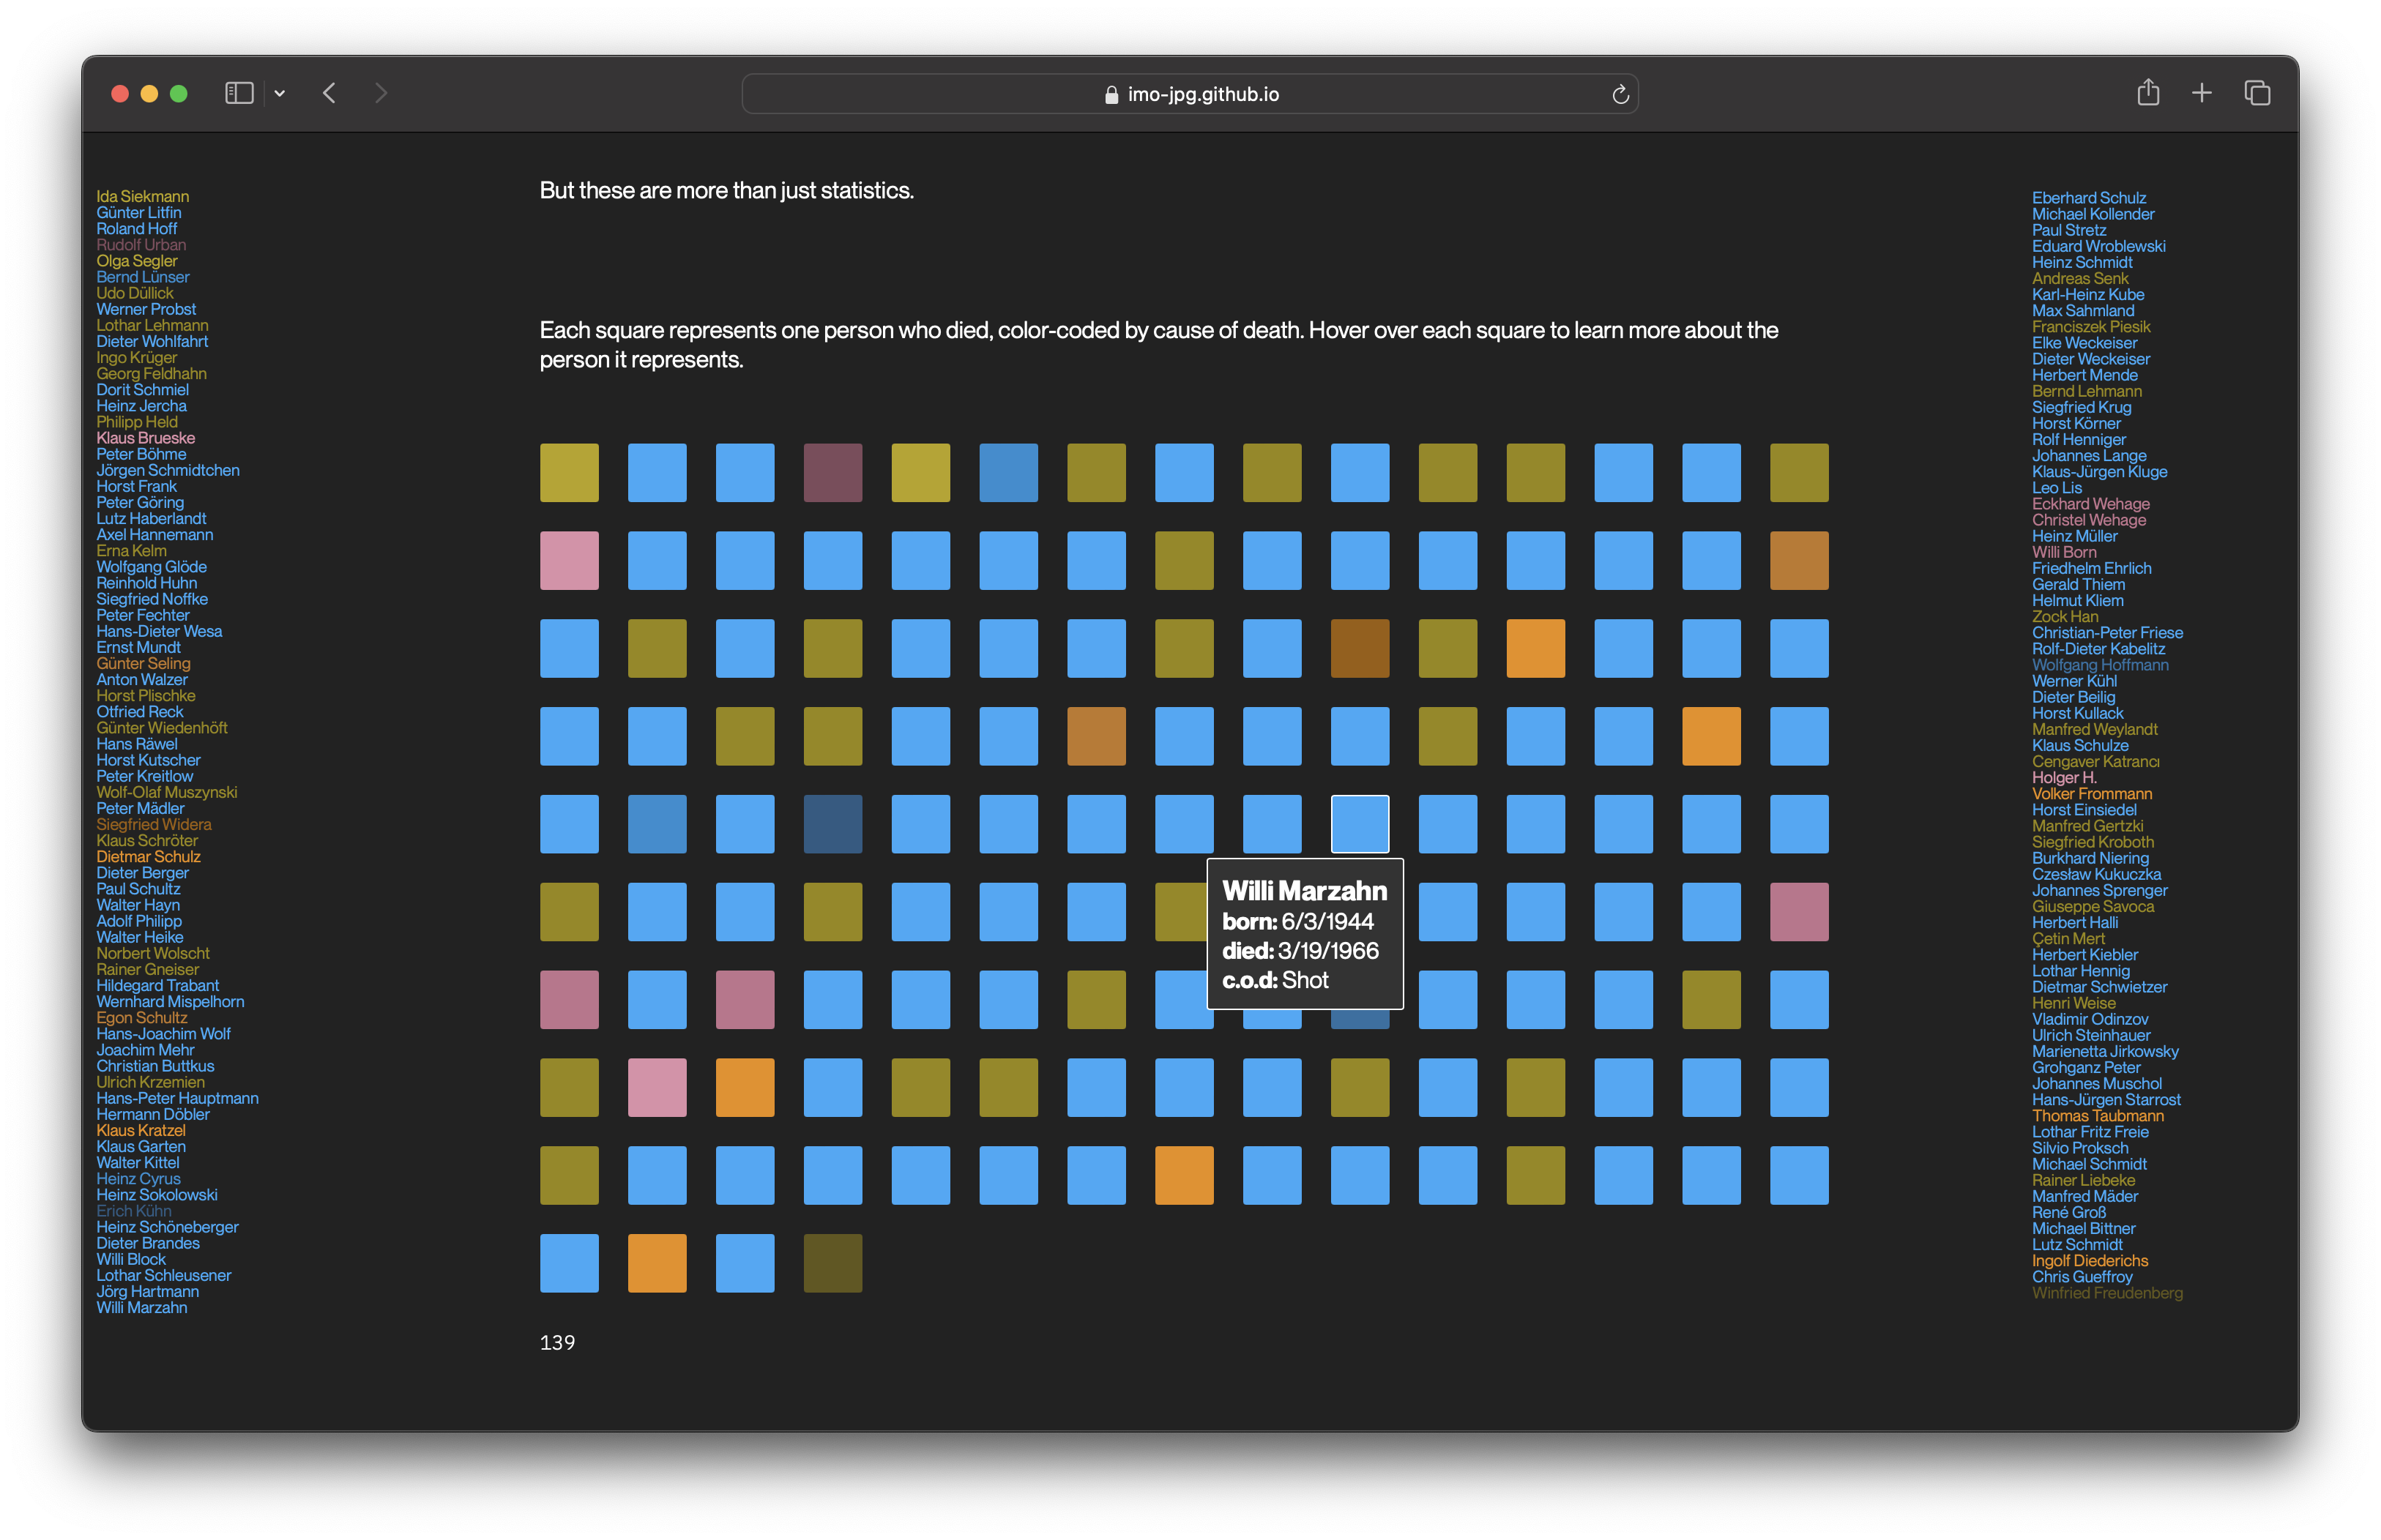
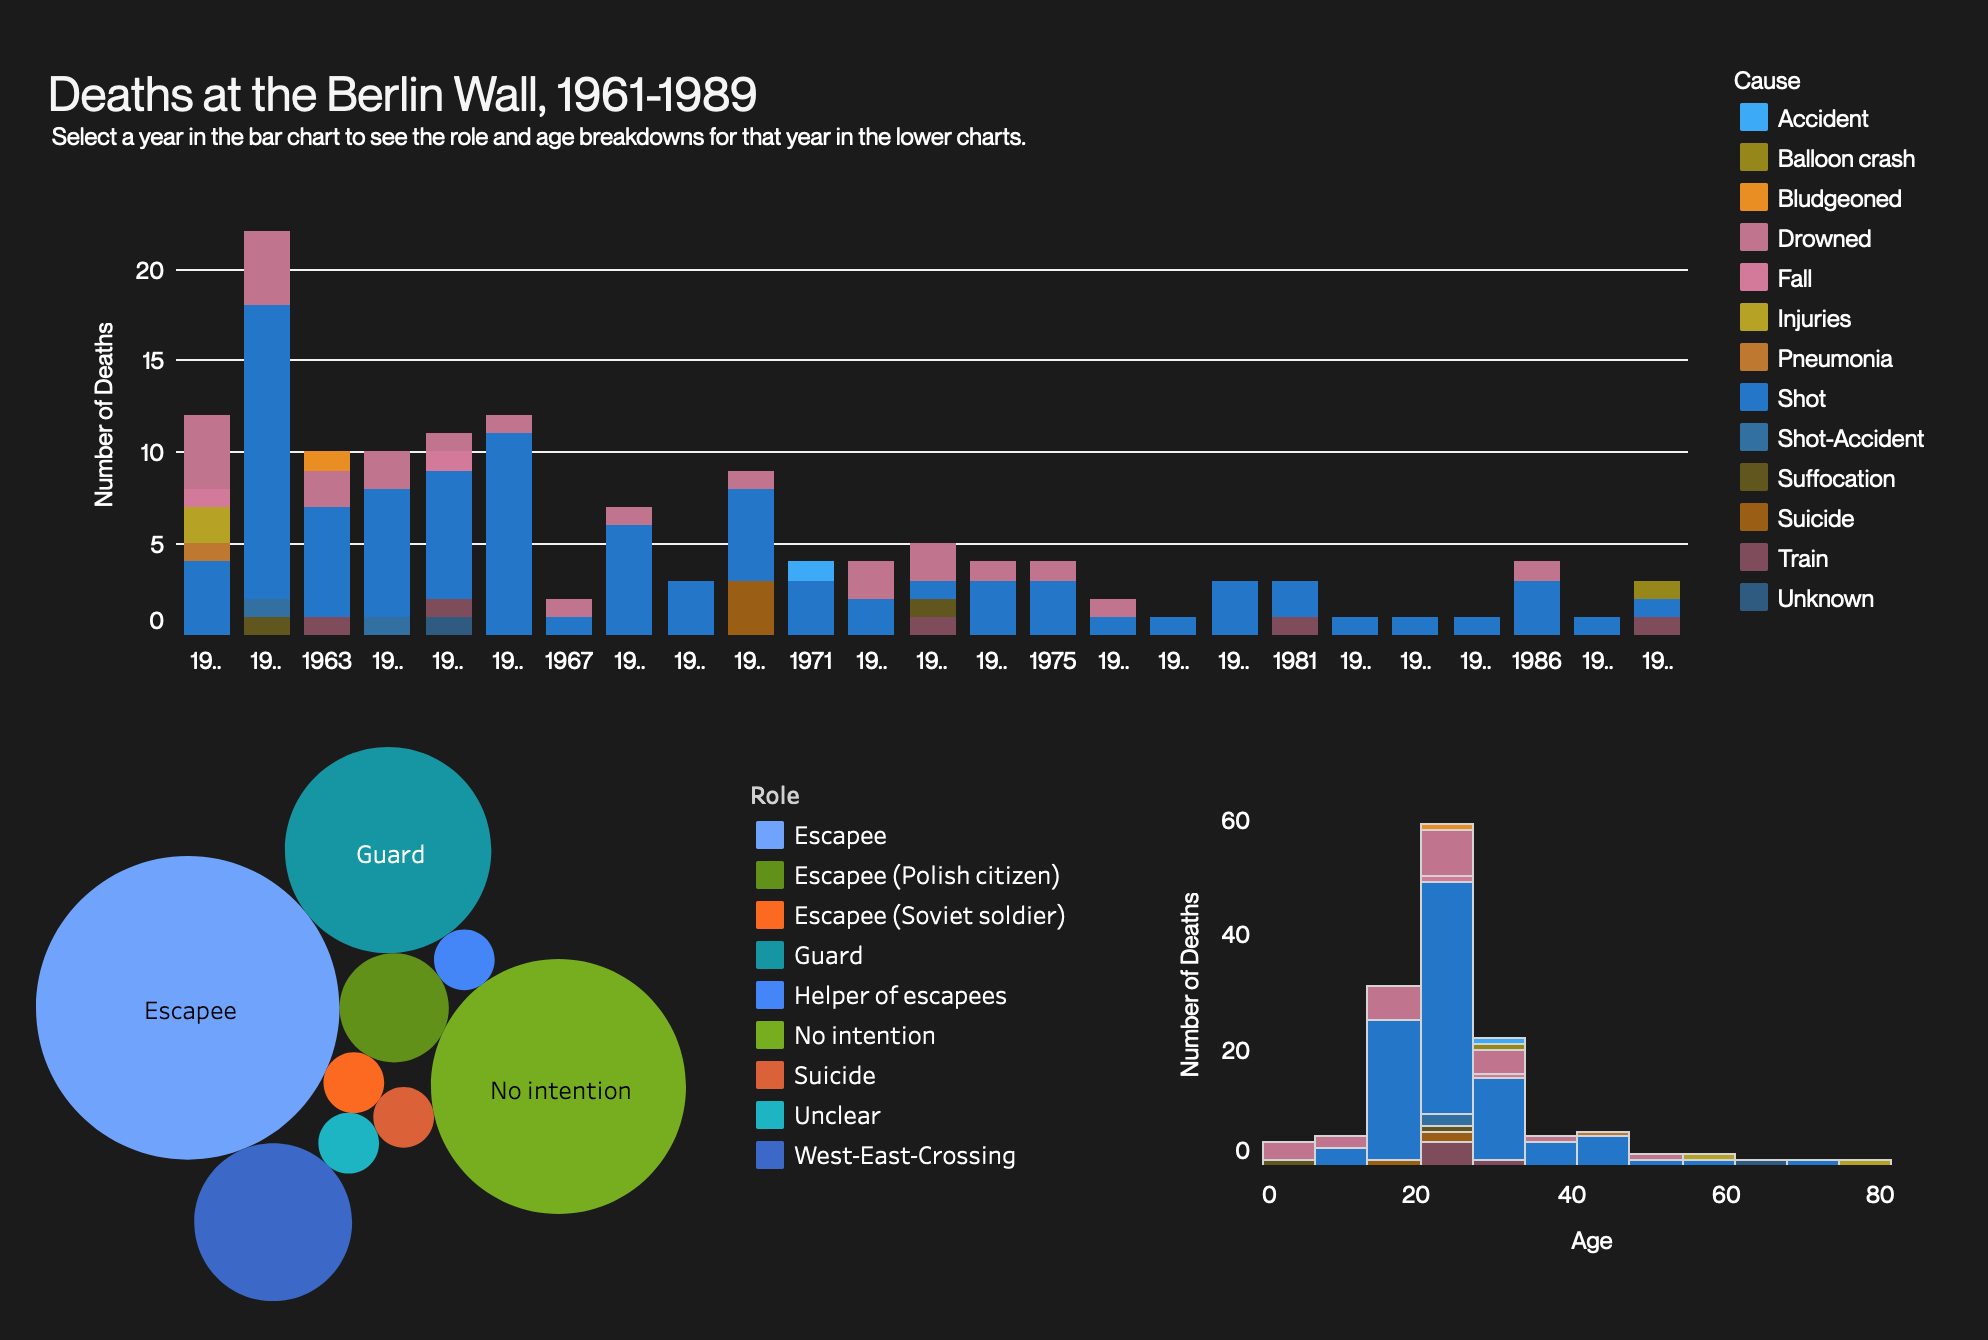
A site built with D3 for the final project of Parson's Infographics and Visual Storytelling class taken as a part of their Infographics and Data Visualization Certificate program. The live site can be found here. (It works best on desktop.)

CMS
2023

Simulation Study Infographic

Data Viz, information design

See Description

I developed an infographic for a Centers for Medicare and Medicaid Services (CMS) report about the effects of reduced nursing staff numbers on levels of patient care. (The first image is the final version, the second an earlier iteration.) You can view the infographic in the published report (in section 4).

Personal
2024

Lifers

Data Viz

See Description

This Marimekko chart shows the breakdown of prison populations by state and sentence length, with an emphasis on people in prison for life. Best viewed at full size.

Personal
2023

Railroad Quality

Data Viz

See Description

Inspired by growing up in Germany and being reminded on a 2023 trip to Europe how great the trains are in countries besides the US, I created this viz to explore how (subjective) train quality varies around the world. Best viewed at full size.